Stormwater Runoff Analyzer
A Python and GIS analysis of rainfall and Mercer Creek streamflow in Bellevue, Washington. I combined a year of public hydrologic observations with a QGIS map to explore high-flow events and how streamflow relates to rainfall over time.
Bellevue, Washington · Water year 2026 · October 2025–September 2026
- Previous-day rainfall correlation
- 0.731
- Strongest of three timings tested
- Peak daily streamflow
- 170.7 cfs
- Recorded December 9, 2025
- Mean daily streamflow
- 19.71 cfs
- Across the study water year
The question behind the analysis
How does Mercer Creek respond to rainfall, and does looking at the previous day’s rain reveal a stronger relationship? I used this question to connect software development, environmental data analysis, and GIS in a focused local project.
The study covers the October 1, 2025–September 30, 2026 water year, using daily observations from the Mercer Creek stream gauge (COB_MCF) and Meydenbauer rain gauge (COB_RG05). King County provided the hydrologic data, and City of Bellevue datasets supplied the streams and storm drainage basins for the map.
01 / Study area
Putting the observations on the map
I used QGIS to bring the drainage basin, stream network, and monitoring stations into one view. The map connects the time-series analysis to the places where the measurements were collected.
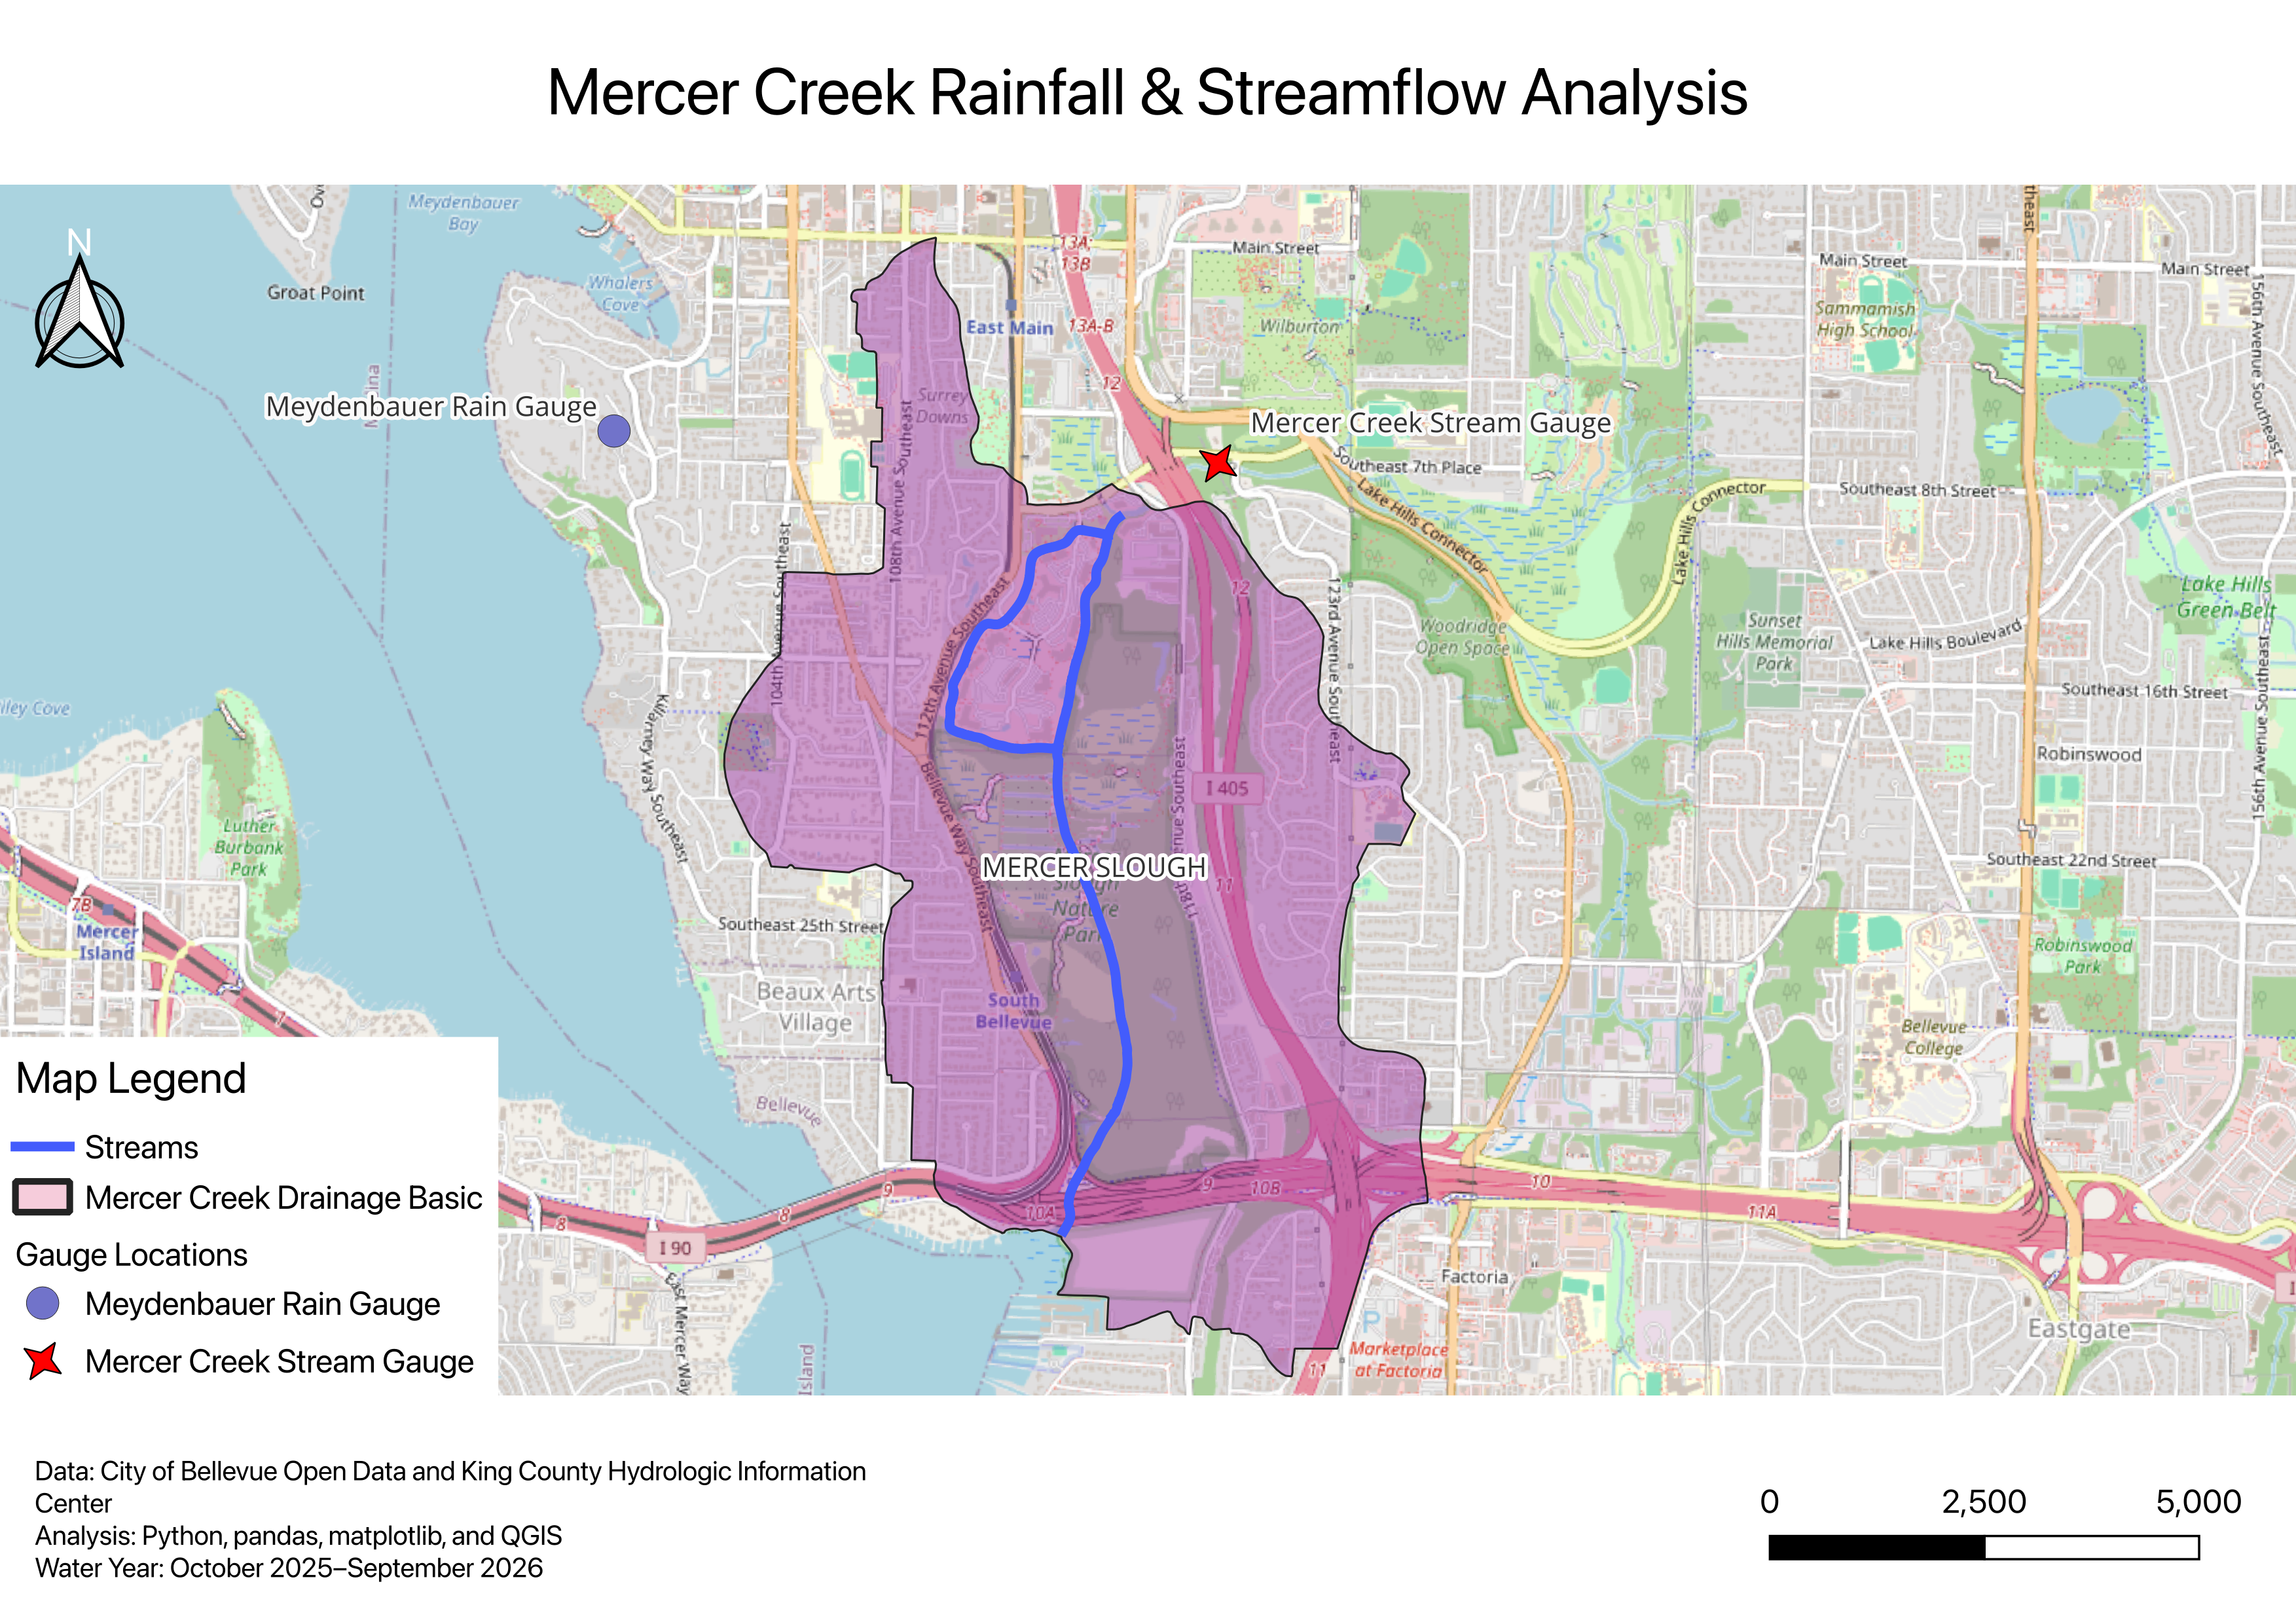
QGIS map placing the hydrologic observations in geographic context. Data: City of Bellevue Open Data and King County Hydrologic Information Center. Basemap: © OpenStreetMap contributors.
Drainage basin
The purple area provides geographic context for the local drainage system.
Stream network
Blue lines show mapped streams across the study area.
Monitoring stations
The rainfall gauge and stream gauge are in different locations—a key consideration when interpreting the results.
02 / Seasonal patterns
Reading a year of streamflow
The daily record shows pronounced peaks during the wetter months and lower flows through summer. Plotting the full water year makes individual events visible within that seasonal pattern.
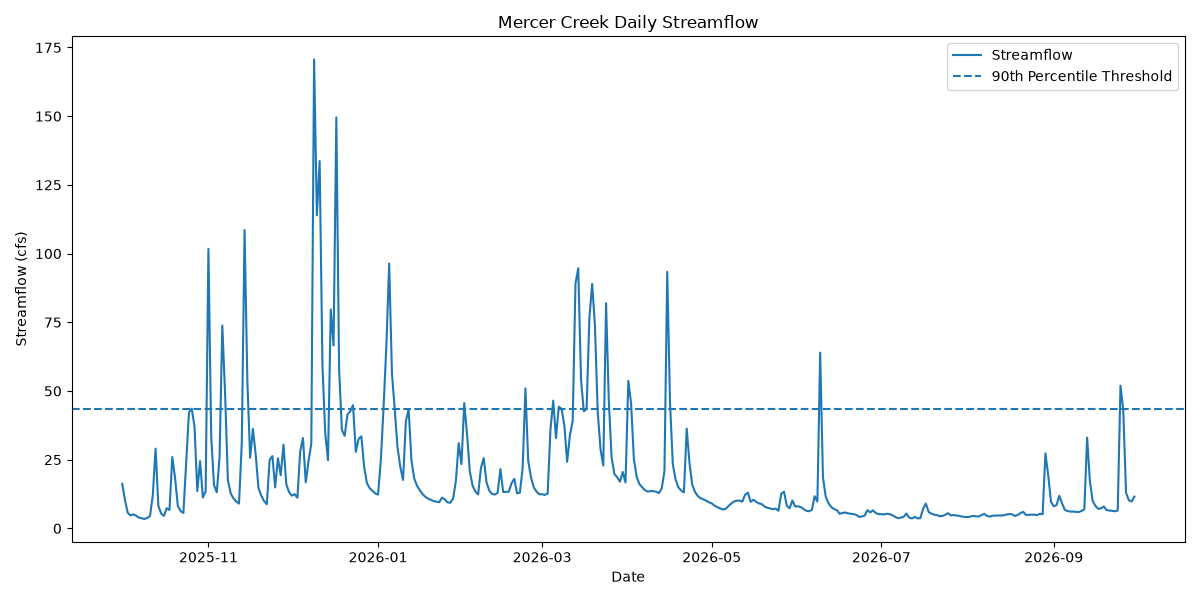
Daily streamflow, October 2025–September 2026. The dashed line marks the dataset’s 90th percentile (43.56 cfs), a comparison threshold rather than a flood designation.
03 / Rainfall + response
Timing changes the relationship
I first compared rainfall and streamflow on the same day, then shifted the rainfall series by one and two days. These two views show both the variation in individual observations and the difference between the three timings.
How do same-day observations compare?
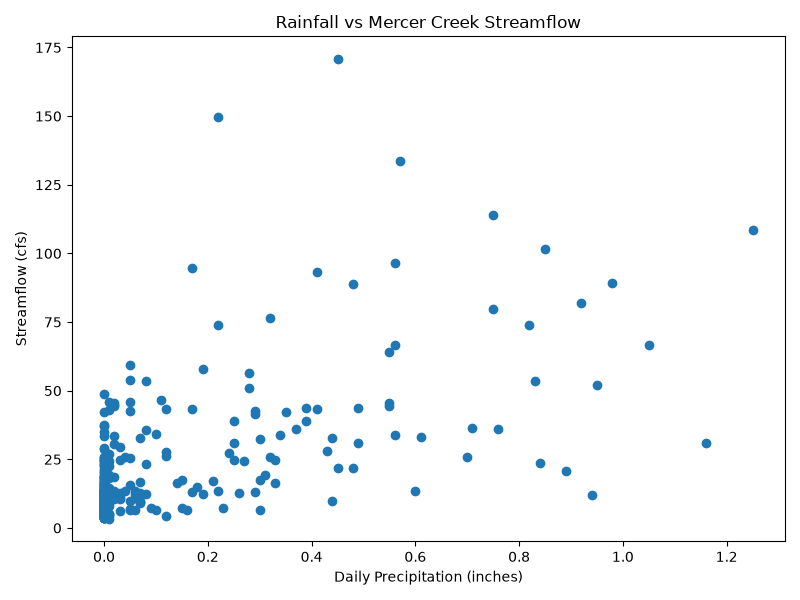
Each point pairs rainfall and streamflow from the same date. The spread of the points shows why rainfall on that day alone does not explain every flow observation.
Previous-day rainfall had the strongest correlation
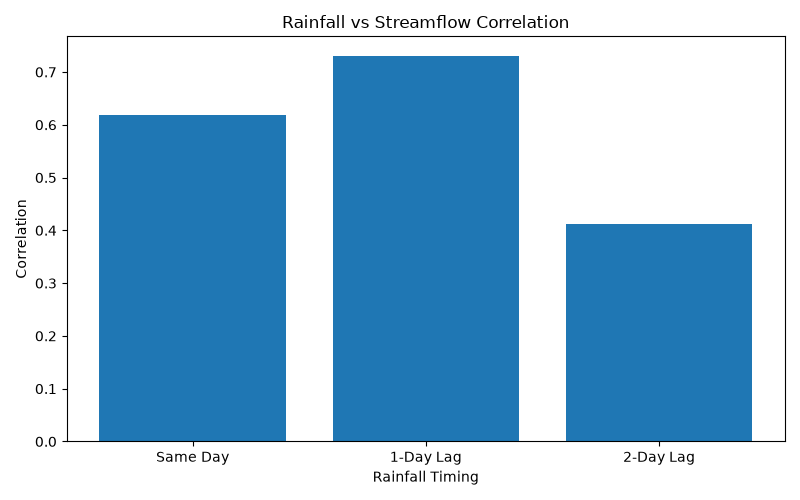
Pearson correlation calculated with pandas for each rainfall timing. These values describe the observed dataset, rather than a predictive model.
The correlation with streamflow was 0.618 for same-day rainfall, 0.731 for rainfall one day earlier, and 0.412 for rainfall two days earlier. Of the three timings tested, previous-day rainfall showed the strongest relationship during this water year.
This pattern is consistent with a delayed streamflow response, but it does not establish a fixed one-day response time for every storm. The comparison uses daily observations, and individual events varied.
04 / Event review
Following a December storm
Viewing rainfall and streamflow on a shared timeline helps explain the lag comparison. The December 8–9 event provides a concrete example: rainfall decreased while the next day’s streamflow rose sharply.
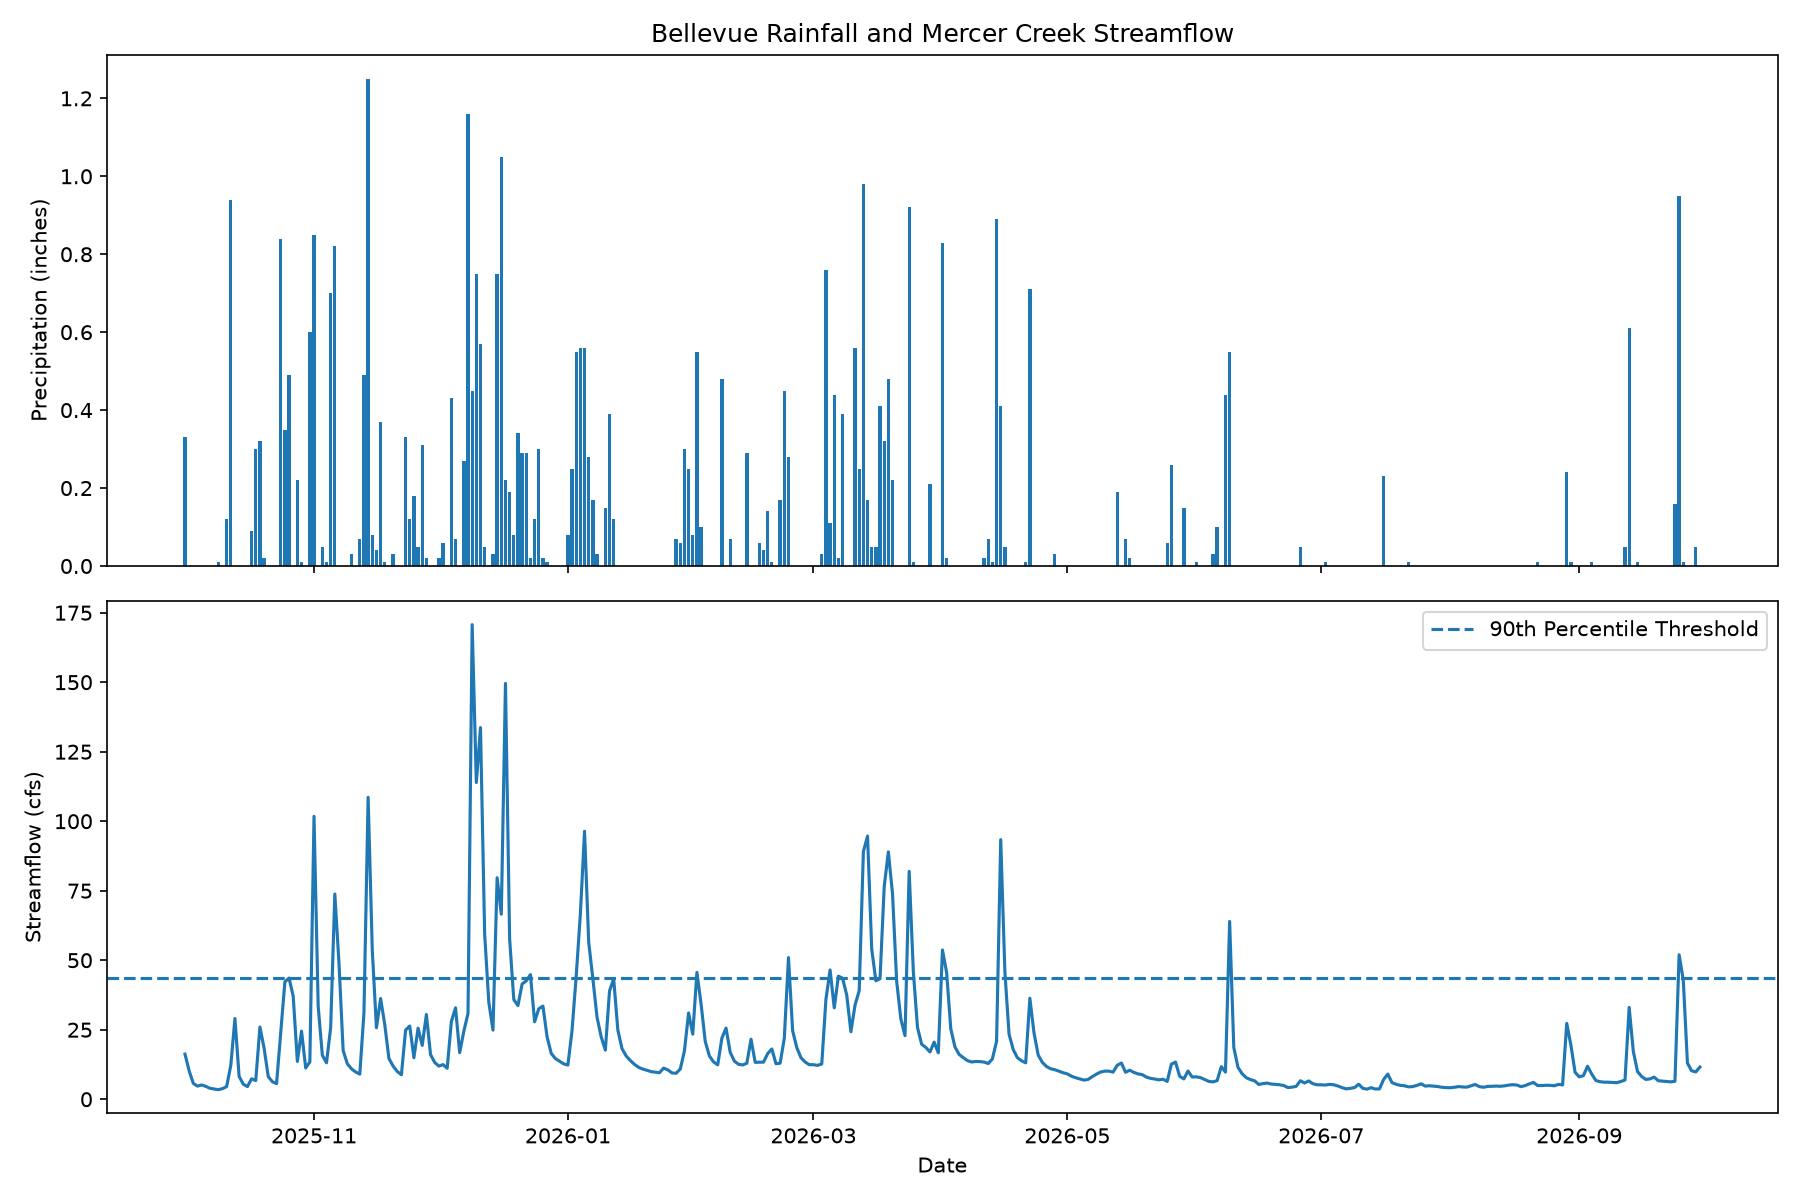
Rainfall and streamflow plotted on a shared date axis, with the 90th-percentile streamflow threshold marked for comparison.
December 8, 2025
- Rainfall
- 1.16 in
- Streamflow
- 30.87 cfs
December 9, 2025
- Rainfall
- 0.45 in
- Streamflow
- 170.7 cfs
Behind the analysis
From public data to documented findings
- A Python workflow using pandas to parse dates, standardize field names, and merge rainfall and streamflow observations by date.
- Summary statistics and a 90th-percentile threshold to identify unusually high-flow days within the study period.
- Same-day, one-day, and two-day rainfall-lag comparisons, supported by an individual storm-event review.
- Matplotlib charts and an exported CSV summary so the analysis results can be inspected alongside the code.
- A QGIS map combining streams, a drainage basin layer, monitoring stations, and an OpenStreetMap basemap.
What I learned & where this can go next
Combining time-series analysis with a map helped me explain both when changes occurred and where the measurements came from. The rainfall and streamflow gauges are at different locations; a single rain gauge does not measure rainfall everywhere across a drainage area.
The source data includes provisional measurements, and the study covers one water year at daily resolution. The completed work is an exploratory analysis, not a calibrated runoff or flood-forecasting model. Higher-resolution observations, more rain gauges, and watershed and impervious-surface data would help investigate the relationship further.