GIS + Software Engineering · In progress
Eastside Bike Routing
Exploring how public GIS data can help cyclists choose more comfortable routes on the Eastside. Starting with Redmond, I’m investigating how elevation, trail surfaces, and bicycle infrastructure can inform route choices beyond distance alone.
Follow the project on GitHub
The work behind the routes.
My repository documents the project as it develops: the QGIS project, data investigations, screenshots, and decisions that will shape the routing prototype.
Explore on GitHubThe Question
Could a slightly longer route be a better ride? Hills, surface conditions, and bicycle infrastructure all affect how comfortable a route feels. I’m exploring how public city data can make those tradeoffs easier to understand.
I began with Bellevue trail data to learn QGIS, then moved to Redmond’s trails, street centerlines, and bicycle facilities. The project is currently in the GIS exploration and elevation-analysis stage, with a web mapping and route-comparison prototype planned next.
What I’ve Done So Far
- Explored municipal GIS layers through attribute queries, spatial selections, filtering, and categorized map styling.
- Documented candidate routing attributes, including trail surface, bicycle access, existing facility type, and posted speed limits.
- Investigated coded values and missing data, keeping existing bicycle infrastructure separate from planned facilities.
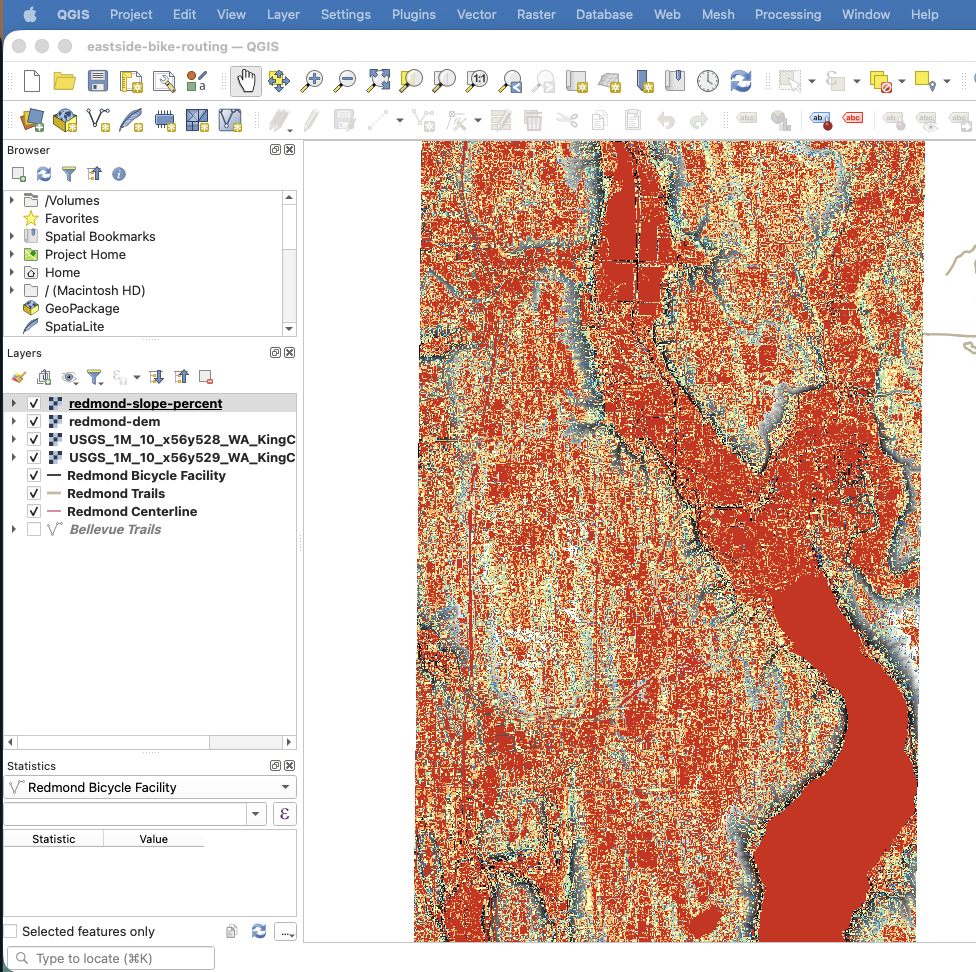
- Combined two USGS 3DEP 1-meter elevation tiles into a virtual raster and calculated terrain slope as percent grade.
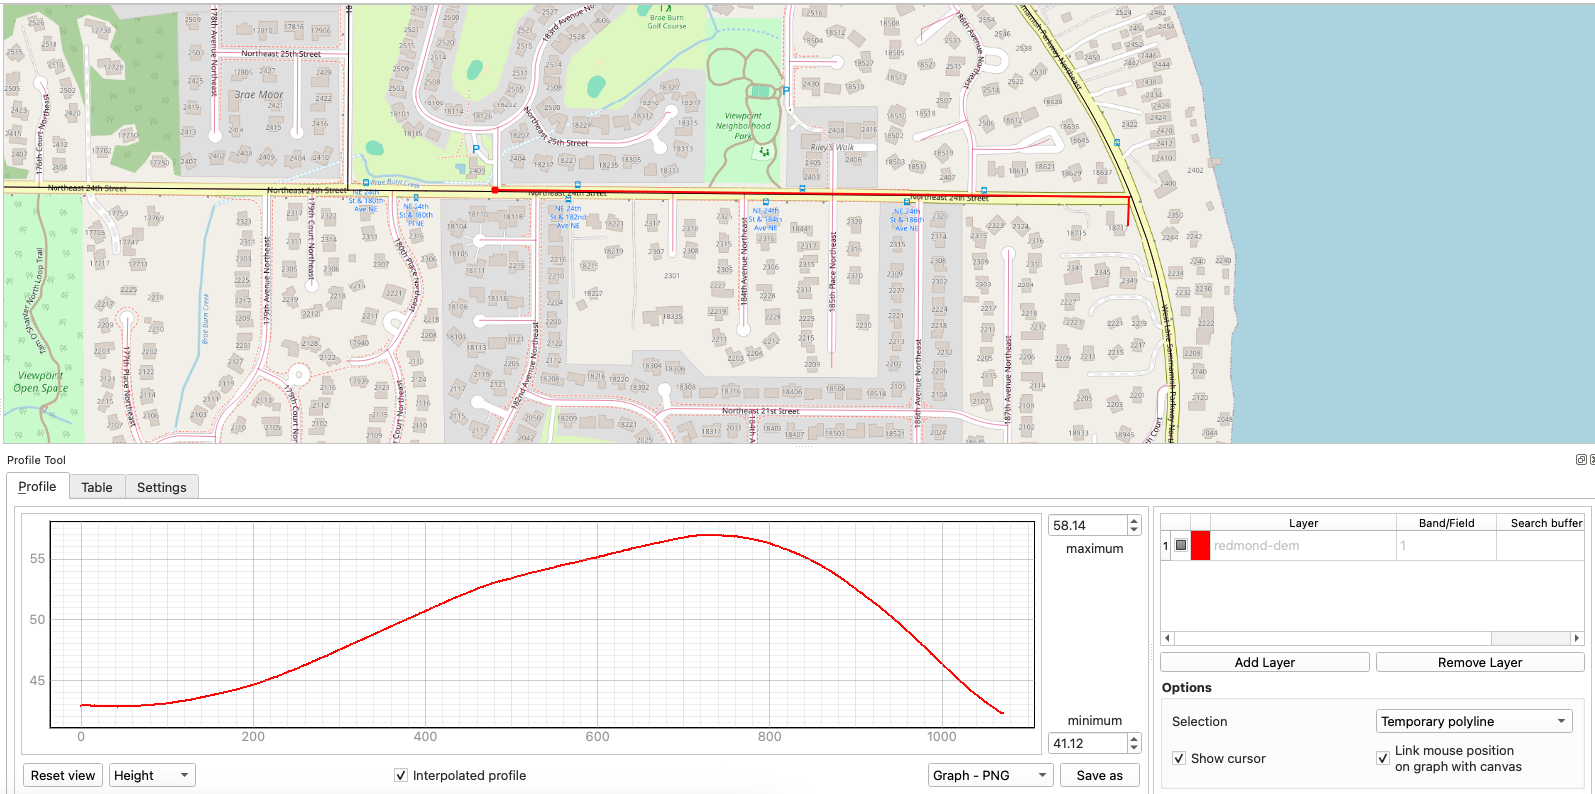
- Tested an elevation profile along NE 24th Street to examine climbs and descents within a route segment.
A Nearly Flat Route Can Still Have a Climb
An approximately 1.08 km test section of NE 24th Street starts and ends around 43 meters above sea level. Looking only at those endpoints would make it appear nearly flat.
The elevation profile tells a different story: a climb of about 14 meters to a crest near 730 meters, followed by a descent. The average climbing grade to that crest is approximately 1.9%.
This finding is shaping the next stage of the project: route analysis needs to account for changes within a segment and direction of travel, rather than relying only on the difference between start and end elevations.
Turning Terrain into Useful Route Information
The 1-meter slope raster captures detailed changes across the study area, but terrain slope is not the same as the grade a cyclist experiences along a road or trail. The map is an exploratory analysis, not a route-difficulty rating.
My next step is to connect elevation samples to actual street and trail segments. I’m also documenting data limitations, such as unknown surface codes and speed-limit values that need verification before they can inform routing decisions.
What’s Next
Planned development builds on the GIS analysis already underway:
- Prepare selected data as GeoJSON and display it in an interactive Leaflet map.
- Explore PostGIS and a preliminary route suitability model using distance, grade, surface, and existing bicycle infrastructure.
- Gather input from local cyclists to understand what makes a route feel comfortable.
- Compare routes for a test origin and destination, explaining the tradeoffs and limitations of the available data.